The global quantity of e-waste generation in 2014 was around 41.8 million tonnes according to United Nations University’s Institute for the Advanced Study of Sustainability study.
United Nations University (UNU) is an autonomous organ of the UN General Assembly dedicated to generating and transferring knowledge and strengthening capacities relevant to global issues of human security, development, and welfare.
The University operates through a worldwide network of research and training centres and programmes, coordinated by UNU Centre in Tokyo.
Co-authored by Kees balde, Feng wang, Jaco Huisman, Ruediger Kuehr, jennifer wong and representatives of United Nations University’s Institute for the Advanced Study of Sustainability, the study revealed that in 2014 shows that approximately and only 4 Billion people are covered by national legislations.
That's approximately four out of every seven people; though legislation does not necessarily come together with enforcement and the lowest amount of e-waste per inhabitant of e-waste was generated in Africa, where only 1.7 kg/inh generated in 2014.
Total E-waste Per Category in 2014
The global quantity of e-waste in 2014 is comprised of 1.0 Mt lamps, 3.0 Mt of Small IT, 6.3 Mt of screens and monitors, 7.0 Mt of temperature exchange equipment (cooling and freezing equipment), 11.8 Mt large equipment, and 12.8 Mt of small equipment. The amount of e-waste is expected to grow to 49.8 Mt in 2018, with an annual growth rate of 4 to 5 per cent.
E-Waste Generation Per Category, Continent And Per Inhabitant
Most of the e-waste was generated in Asia: 16 Mt in 2014. This was 3.7 kg for each inhabitant. The highest per inhabitant e-waste quantity (15.6 kg/inh.) was generated in Europe.
The whole region (including Russia) generated 11.6 Mt. The lowest quantity of e-waste was generated in Oceania, and was 0.6 Mt. However, the per inhabitant amount was nearly as high as Europe’s (15.2 kg/inh.).
The lowest amount of e-waste per inhabitant was generated in Africa, where only 1.7 kg/inh. was generated in 2014. The whole continent generated 1.9 Mt of e-waste.
The Americas generated 11.7 Mt of e-waste (7.9 Mt for North America, 1.1 Mt for Central America, and 2.7 Mt for South America), which represented 12.2 kg/inh.
Specifically, available records indicate that an estimated 0.1 Mt of e-waste was imported into Nigeria in 2010 and another 0.1 Mt of second hand (repairable) equipment was imported into Nigeria in 2012).
In this scenario, e-waste is usually collected by self-employed peddlers, who usually buy e-waste from consumers, while imported equipment can be used in households, or sent straight to scrap-yards Imports of hazardous waste have to comply with the Basel Convention, as evident at Otiga and computer village in Lagos.
On Regional Details Of E-Waste Management, the study suggests that in Africa, the total e-waste generation was 1.9 Mt in 2014.
Meanwhile, only Cameroon and Nigeria have enforced national e-waste related legislation, while Ghana, Ethiopia and Kenya still have legislation pending approval.
The top three African countries with the highest e-waste generation in absolute quantities are Egypt (0.37 Mt), South Africa (0.35 Mt) and Nigeria (0.22 Mt).
The top three African countries with the highest e-waste generation in relative quantities are Equatorial Guinea (10.8 kg/inh.), Seychelles (10.9 kg/inh.) and Mauritius (9.3 kg/inh.).
In contrast with these relatively wealthy countries, the whole continent only generates 1.7 kg/inh. of e-waste domestically (excluding imports) annually.
The study reports that “Very few official government reports are available on e-waste management in Africa. On the continent, the e-waste challenge is on the political agenda the past couple of years, but there is generally a lack of e-waste management infrastructure, which is reflected by the absence of e-waste management laws.
“Africa, particularly the western Africa, becomes the dumping destination for e-waste from various regions of the world. This is because the East and Southern African regions have gradually put measures to prevent the dumping of e-waste, and it started to take effect. Illegal import of e-waste or used electronics from all over the world is a major source of e-waste in countries like Ghana and Nigeria.
“This is driven by the demand of inexpensive EEE and secondary materials, as well as cheap dumping prices compared to the treatment with stricter standards in the export countries. The recycling activities of e-waste in Africa are usually carried out on an informal basis, often involving open burning in unmonitored dumpsites or landfills”.
“This rudimentary recycling has caused substantial damage to the health of scavengers and local environment. If properly regulated and managed, recycling of e-waste can help to develop local economies and reduce poverty,” the study recommended.
eWaste: Africa Generates 1.7 kg/inh Least of Global- Study
Comms Week8 Jun 20150 Comments
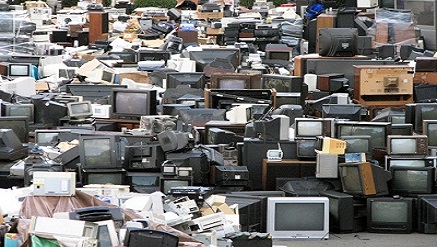
The global quantity of e-waste generation in 2014 was around 41.8 million tonnes according to United Nations University’s Institute for the Advanced Study of Sustainability study. United Nations…
C
Published by
Comms Week
Trained and practicing journalist passionate about telecommunications, fintech, cybersecurity, and digital economy reporting.
You May Like

Google Issues Urgent Chrome Update to Block Active Attacks

RockPay Launches, Targets Digital Payments through Social Finance

NDIC Still Paying Depositors of 46 Failed MFBs — Sunday
NITDA Inaugurates Taskforce to Drive Sovereign Cloud Implementation

SEC Proposes N2bn Capital Requirement, N30m Registration Fee for Crypto Firms