E-Business
Non-Techie Businesses IT Budget to Exceed IT Organization- Report

A new update to the Worldwide Semiannual IT Spending Guide: Line of Business from the International Data Corporation (IDC) forecasts worldwide corporate IT spending funded by non-IT business units will reach $609 billion in 2017, an increase of 5.9% over 2016.
The Spending Guide, which quantifies the purchasing power of line of business (LoB) technology buyers by providing a detailed examination of where the funding for a variety of IT purchases originates, also forecasts LoB spending to achieve a compound annual growth rate (CAGR) of 5.9% over the 2015-2020 forecast period.
In comparison, technology spending by IT buyers is forecast to have a five-year CAGR of 2.3%. By 2020, IDC expects LoB technology spending to be nearly equal to that of the IT organization.
“Companies’ adaptation of Innovation Accelerators, such as Internet of Things, Cognitive/AI systems, and 3D Printing, together with the four Pillar technologies of the 3rd Platform, to both new product and service developments and day-to-day business operations has fundamentally increased Line of Business spending on IT,” said Naoko Iwamoto, senior market analyst with the IDC Japan IT Spending Group.
“The Innovation Accelerators have put the line of business units in the frontline of the digital transformation and have forced them to work either alone with the ecosystem outside of the IT organization as ‘shadow IT’ or in closer collaboration with the IT department than ever before.”
IDC’s Line of Business taxonomy identifies two major types of technology spending – purchases funded by the IT organization and purchases funded by technology buyers outside of IT. Joint purchases can be funded by either IT or the functional business unit while “shadow IT” projects are funded from the functional area budget without the knowledge, involvement, or support of the IT department.
Although some technology categories are dominated by IT spending, most involve outlays from both IT and the business units. For example, worldwide IT spending on servers, storage, and network equipment is forecast to total $114.1 billion this year, while LoB spending on these items will total $52.9 billion.
However, IT is not the primary source of funding for all hardware purchases. Business unit spending on PCs, monitors, mobile phones, printers, and tablets will total $83.8 billion worldwide this year compared to $76.2 billion spent by the IT department. And line of business buyers will spend more on software applications in 2017 ($150.7 billion) than IT buyers ($64.7 billion).
The technology categories that will see the most spending from LoB buyers in 2017 will be applications ($150.7 billion), project-oriented services ($120.3 billion), and outsourcing ($70.3 billion).
The categories that will receive the most spending from IT buyers this year will be outsourcing ($149.2 billion), project-oriented services ($82.2 billion), and support and training ($79.8 billion).
Combined IT-LoB purchases of outsourcing and project-oriented services ($422 billion) will represent nearly one third of all technology spending worldwide in 2017. The technology categories that will see the fastest growth in spending over the 2015-2020 forecast period are tablets (16.2% CAGR for IT and LoB purchases combined) and midrange enterprise servers (14.7% combined CAGR).
LoB buyers will also continue to invest aggressively in applications and application development and deployment (8.5% and 9.3% CAGRs, respectively).
In 2017, IDC expects LoB technology spending to be larger than IT organization spending in five industries: discrete manufacturing, healthcare, media, personal and consumer services, and securities and investment services.
By 2020, this number is forecast to grow to nine as the insurance, process manufacturing, professional services, and retail industries see LoB purchases move ahead of IT purchases. The industries with the fastest growth in LoB spending are professional services (6.9% CAGR), healthcare (6.6%), and banking (6.5%).
However, LoB technology spending is forecast to grow faster than that of the IT organization in all 16 industries covered in the spending guide.
On a geographic basis, the IT organization will be the largest source of technology spending throughout the forecast in all but four countries: the United States, Canada, Saudi Arabia, and the United Arab Emirates.
And like the industry trend, LoB spending is forecast to grow at a faster rate than IT-led technology spending in nearly every country.
The countries that will experience the fastest LoB spending growth include Indonesia and the Philippines (each with a 12.2% CAGR), Argentina (11.1% CAGR), Peru (8.7% CAGR), and India (8.4% CAGR).
“Explosive cloud and other 3rd Platform technology adoption is enabling U.S. lines of businesses to rely less on enterprise IT than any other country to fund their technology purchases,” said Eileen Smith, program director, Customer Insights and Analysis.
“On average, U.S. line of business will fund 62% of their technology purchases in 2017. Looking to increase productivity and reduce organizational costs, IDC expects supply chain, human resources, and sales executives will fund the largest share of their companies’ technology purchases over the forecast period.”
“While the LoB-funded IT spending shows steady growth of 3.1% CAGR in the forecast period in Japan, almost 70% of technology spending comes from IT with a 1.3% CAGR,” said Iwamoto.
“As the competition escalates in the worldwide marketplace as well as with the disruptors from different industry segments, Japanese companies are trying to hold their position by employing a globally standardized IT and business processes initiated at the headquarters. The reinforcement of the IT governance among Japanese large enterprises will keep the higher ratio of IT funded.”
The IDC Worldwide Semiannual IT Spending Guide: Line of Business quantifies the purchasing power of the non-IT department technology buyer by detailing enterprise IT spending for 20 technologies and 12 corporate functional areas across 16 enterprise industries in eight regions and 53 countries.
This IDC Spending Guide provides a granular view of the market for IT spending from a geographic, industry, functional (LoB), and technology perspective. Unlike any other research in the industry, the LoB Spending Guide was designed to help business and IT decision makers to better understand the scope and direction of corporate technology spending over the next five years.
E-Business
Microsoft Server Hack Likely Solo Actor, Thousands at Risk

A widespread cyberattack targeting Microsoft’s (MSFT.O) server software used by thousands of government agencies and businesses for internal document sharing was likely orchestrated by a single actor, a cybersecurity researcher said on Monday.

Microsoft issued an alert on Saturday warning of “active attacks” on on-premise SharePoint servers.
The company clarified that SharePoint Online, part of the Microsoft 365 cloud suite, was not affected by the exploit, which is considered a “zero-day” vulnerability due to its previously undiscovered nature.
“Based on the consistency of the tradecraft seen across observed attacks, the campaign launched on Friday appears to be a single actor. However, it’s possible that this will quickly change,” Rafe Pilling, director of Threat Intelligence at Sophos, a British cybersecurity firm.
That tradecraft included the sending of the same digital payload to multiple targets, Pilling added.
Microsoft said it had “provided security updates and encourages customers to install them,” a company spokesperson said in an emailed statement.
It was not clear who was behind the ongoing hack. The FBI said on Sunday it was aware of the attacks and was working closely with its federal and private-sector partners, but offered no other details.
Britain’s National Cyber Security Centre did not immediately respond to a request for comment.
The Washington Post said unidentified actors in the past few days had exploited a flaw to launch an attack that targeted U.S. and international agencies and businesses.
According to data from Shodan, a search engine that helps to identify internet-linked equipment, over 8,000 servers online could theoretically have already been compromised by hackers.
Those servers include major industrial firms, banks, auditors, healthcare companies, and several U.S. state-level and international government entities.
“The SharePoint incident appears to have created a broad level of compromise across a range of servers globally,” said Daniel Card of British cybersecurity consultancy, PwnDefend.
“Taking an assumed breach approach is wise, and it’s also important to understand that just applying the patch isn’t all that is required here.”
E-Business
Flaw in Microsoft SharePoint Sparks Global Cybersecurity Concern

A Microsoft SharePoint server software flaw is causing widespread concern across the global cybersecurity landscape, exposing thousands of organisations to hackers exploiting a new vulnerability.

This critical vulnerability exposes government agencies, universities, and energy firms who are at risk of cyberattacks. The flaw, now being actively exploited by unidentified hackers, allows attackers to gain deep, remote access to on-premise SharePoint servers.
The U.S. Cybersecurity and Infrastructure Security Agency (CISA) has confirmed that the vulnerability can enable malicious actors to access internal files, change configurations, and even execute remote code, effectively giving them high-level control over compromised systems.
Microsoft has also acknowledged the breach and released a security patch aimed at stopping the ongoing attacks. The firm urged users to apply the patch immediately, saying it is working to roll out additional protections, according to a statement reported by Bloomberg.
Despite these efforts, cybersecurity researchers warn that systems may remain vulnerable if attackers have already infiltrated networks, stolen authentication keys, or implanted persistent backdoors before patches were applied.
The United States hosts the highest number of these vulnerable systems, followed by the Netherlands, the United Kingdom, and Canada.
The Washington Post reported that the breach has already impacted a range of institutions, including U.S. federal and state agencies, academic institutions, energy companies, and a telecommunications firm in Asia.
This latest incident adds to a growing list of cybersecurity challenges facing Microsoft. In March, the company revealed that Chinese state-backed hackers had targeted its cloud-based services to infiltrate both U.S. and international organisations.
Last year, the U.S. Cyber Safety Review Board sharply criticised Microsoft’s internal security culture as ‘inadequate’ after a separate breach compromised its Exchange Online mail systems and exposed communications of high-level officials.
E-Business
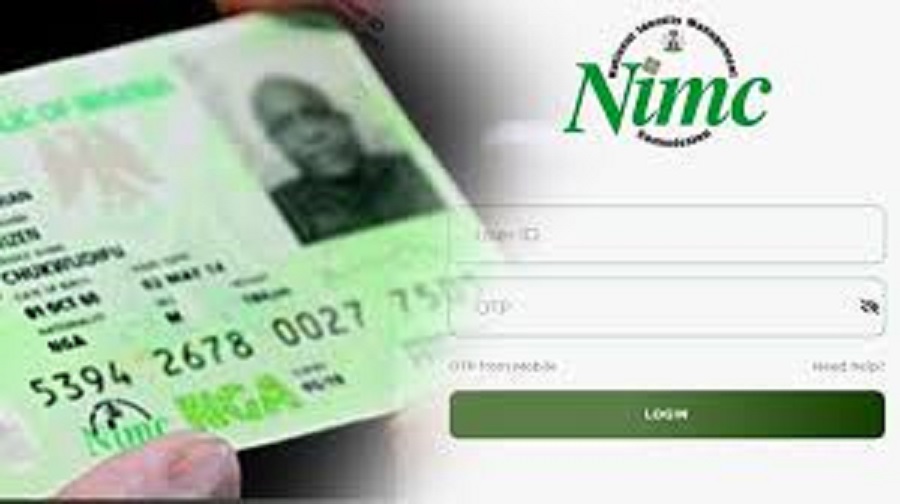
NIMC Enrolls 122m for NIN, Cuts Extortion by 40 Percent

National Identity Management Commission (NIMC) has said that it has reduced incidents of extortion and unofficial charges in the identity enrolment process by over 40 per cent.

Abisoye Coker-Odusote, director general of NIMC,
Abisoye Coker-Odusote, director general of NIMC, who disclosed this at an event in Lagos at the weekend, attributed the drop to improved transparency in fee structure at the commission.
The CEO was represented by Lanre Yusuf, director, Information Technology and Identity Database, NINC.
The workshop, organised by the identity regulator in partnership with the Guild of Corporate Online Publishers, focused on repositioning Nigeria’s digital identity landscape and combating misinformation.
According to Coker-Odusote, the sharp reduction in illicit charges is a direct result of reforms introduced by NIMC to curb racketeering and unauthorised payments, which have for years plagued the national identity registration process..
“Enrolment for the National Identification Number remains free. We have standardised modification and authentication fees, and these are publicly disclosed. Our enforcement of a transparent fee structure has resulted in a 40 per cent drop in extortion and unofficial charges,” the regulator said.
She explained that prior to her assumption of office, complaints about exploitative fees at enrolment centres were widespread, fuelling public distrust in the system.
However, she noted that the commission had since prioritised transparency and stakeholder accountability, ensuring that Nigerians no longer have to pay above the legally mandated fees. “We are addressing deep-rooted issues that once undermined public confidence in the enrolment process,” she said.
The NIMC chief added that the commission had introduced digital tools to reduce human interference in the registration process.
These include the NINAuth mobile app, the Self-Service NIN Enrolment and Modification app, and Contactless Biometric Solutions, all designed to make the system more efficient, secure, and user-friendly.
Coker-Odusote also reiterated the commission’s commitment to inclusion, stressing that no Nigerian should be left behind in the country’s digital identity transformation.
According to her, over 7,167 front-end enrolment agents and partners have been revalidated and retrained to serve the public professionally, with strict monitoring mechanisms now in place.
In addition, NIMC has deployed grievance redress officers across all 36 states to handle complaints from Nigerians about enrolment centres and agents, with a 24/7 toll-free line available to report any misconduct.
The reforms are part of broader efforts by the Commission to build a unified, secure, and people-centred digital identity system that facilitates access to government services, financial inclusion, social protection, and national planning.
Coker-Odusote called on media partners to support the Commission in disseminating accurate information, countering misinformation, and raising awareness about the benefits of digital identity.
“We are asking our partners in the media to help us combat fake news and promote transparency in the identity ecosystem. We need to ensure every Nigerian understands their rights and knows that their identity is key to accessing opportunities and services,” she said.

 E-Financial2 days ago
UBA’s LEO Becomes Africa’s First Chatbot to Enable Cross-Border Payments

 News2 days ago
UN Appoints Sa’id, Nigerian to Nuclear Panel

 E-Business2 days ago
NIMC Enrolls 122m for NIN, Cuts Extortion by 40 Percent

 Telecom2 days ago
MTN Urges Nigerian to Regards Telecom Infrastructure as National Assets

 General News2 days ago
Appeal Court Nullifies Registration of ‘KPMG Professional Services’

 Telecom22 hours ago
MTN Nigeria Rewards 1,500+ Winners with ₦290m in Mega Billion Promo

 Telecom2 days ago
Bitget Launches $6M Global Crypto Trading Contest with New Competitive Segments

 E-Financial2 days ago
SEC to Introduce USSD Codes to Fight Ponzi Schemes


